In 2017 the Scanex Group and the Shirshov Institute of Oceanology of the Russian Academy of Sciences (IO RAS) carried out a joint pilot project in the Persian Gulf. The objective was to monitor oil spills in the region and determine major pollution sources. The results of the research confirmed the information that the Gulf suffers from considerable oil pollution.
Satellite Monitoring of Oil Pollution in the Persian Gulf
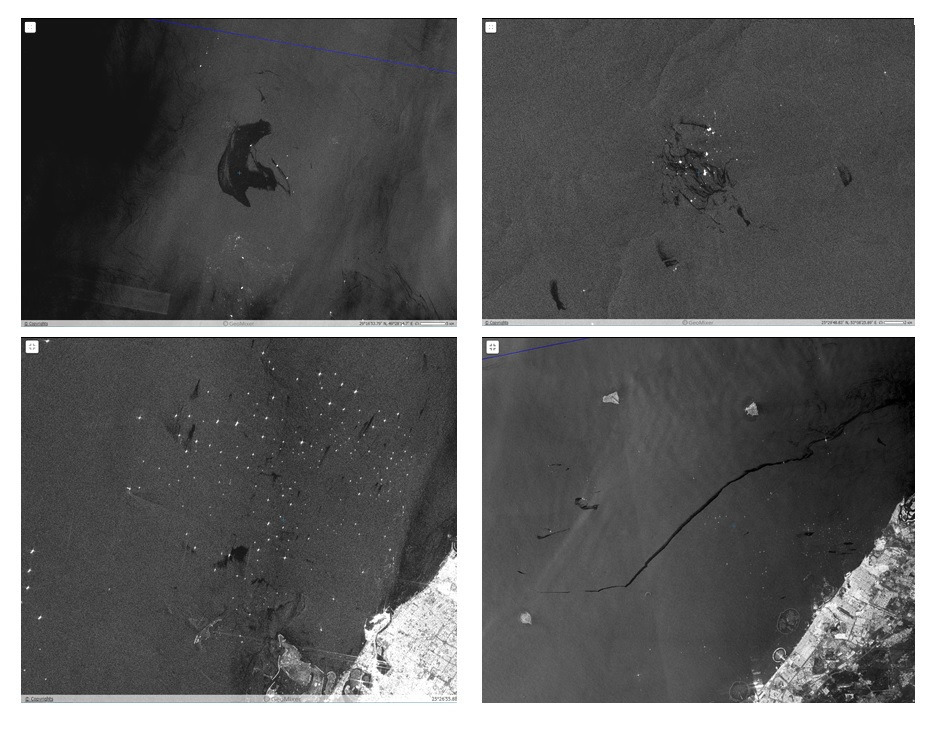
The Persian Gulf is constantly exposed to oil pollution: according to environmental agencies, the pollution of its waters is steadily increasing as a result of intensive oil production (there are 34 oilfields with more than 800 wells), severe tanker traffic (up to 20–30 thousand tankers per year), pipeline leakage, ship navigation and accidents at sea (Figs. 1, 2). According to experts’ estimates, in average 100–160 thousand tons of oil and oil products end up in the Gulf every year, and the level of oil pollution exceeds the world average by 47 times.
Fig. 1. Examples of typical oil spills detected on
To monitor the state of the Gulf’s water surface, specialists applied the technology of integrated operational satellite monitoring developed by Scanex, which makes it possible to detect oil pollution with high reliability. The analysis was based on synthetic aperture radar (SAR) imagery from the European
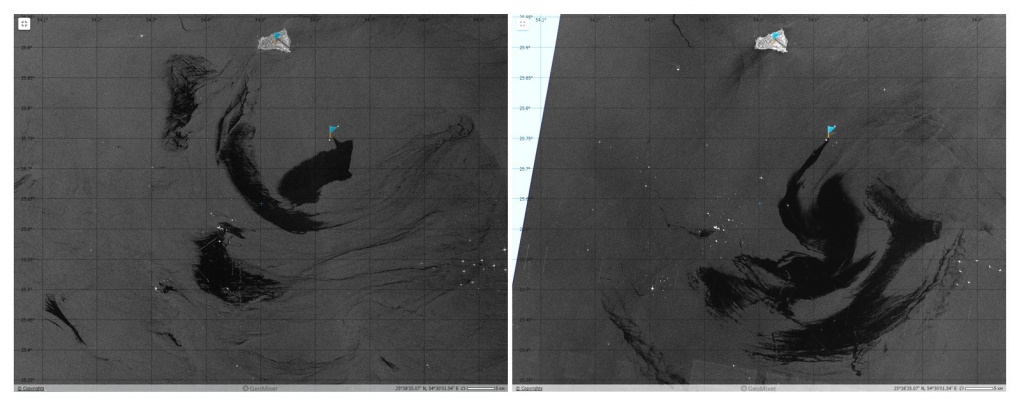
Fig. 2. Anomalously large oil spills in the Persian Gulf on the
In all, over the course of the project in 2017, more than 300 SAR images from the
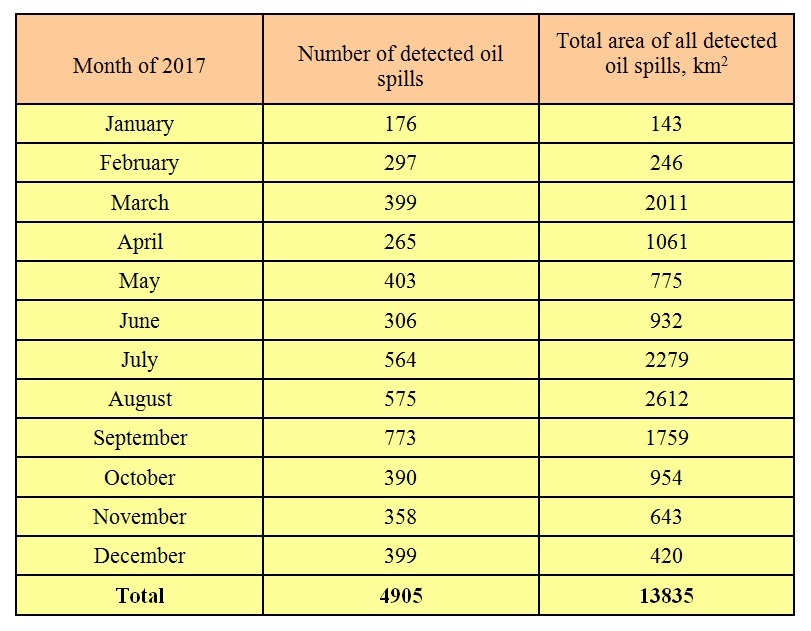
Table. Number and area of oil spills detected during monitoring
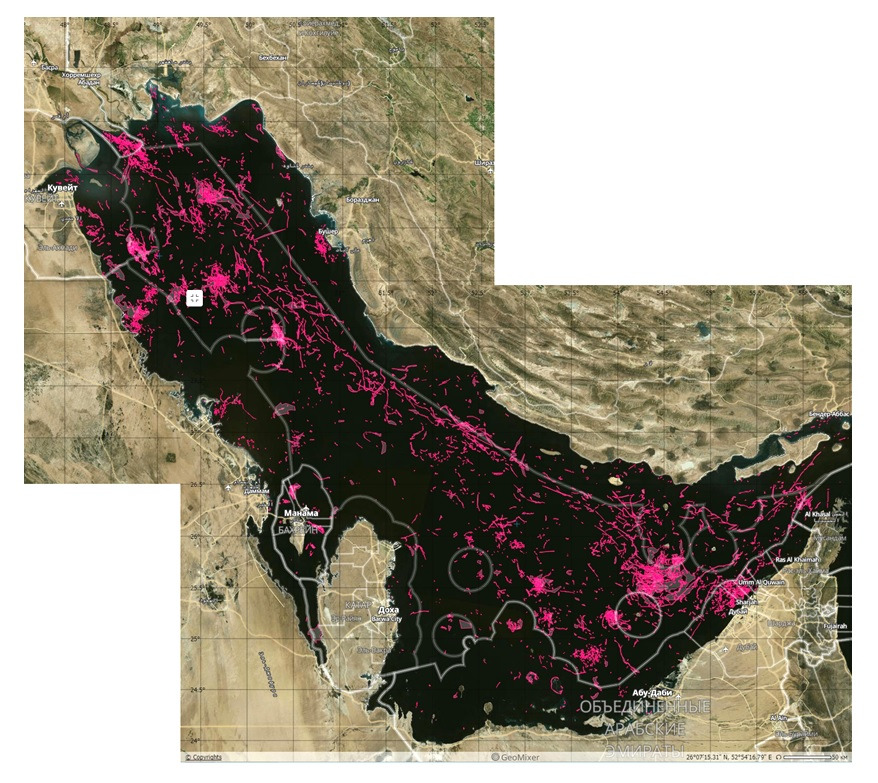
The total area of the detected pollution is found to be 13 835 sq. km. The area of individual spills varied from 0.5 to 600 sq. km. Oil pollution of anthropogenic origin in the Persian Gulf was found almost everywhere (Fig. 3). The vast majority of oil spills is associated with oil and gas production areas, as well as with major shipping routes, some of which run along the long axis of the Gulf and connect large oil terminals and ports. Anomalously large oil spills (240 to 780 sq. km) were detected in the Iranian sector of the Gulf (south off Siri Island) in
Fig. 3. Summary map of all oil spills detected in the Persian Gulf in 2017 on the
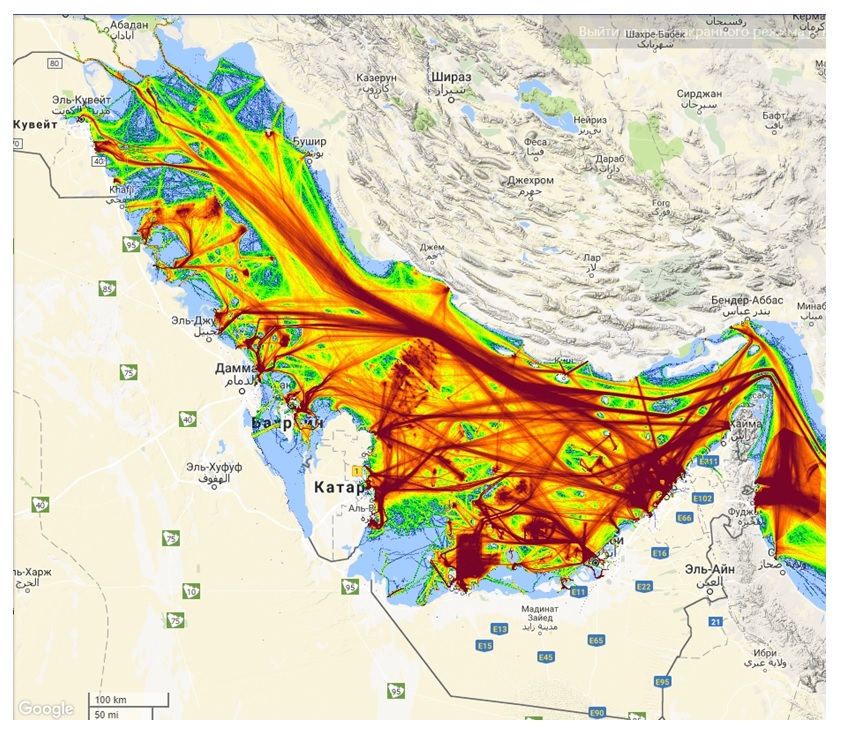
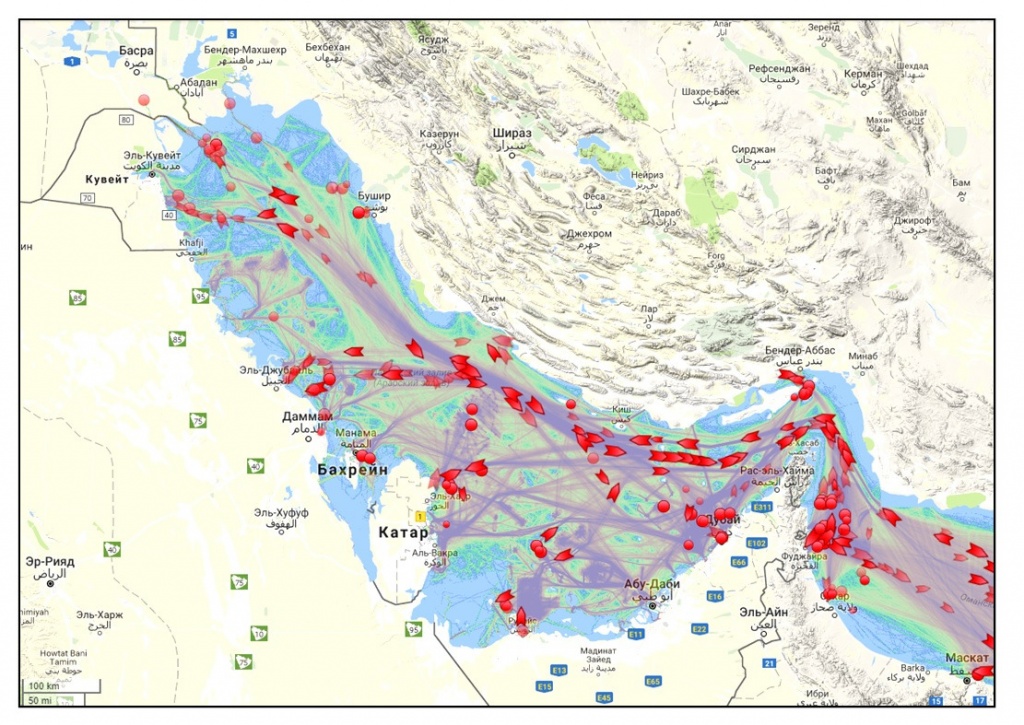
A significant part of the detected ship oil spills was produced as a result of either regular ship operations including tank washings, ballast water discharges and discharges of ship waste containing oil products (bilge and engine room waters, residual oil products, etc.) or illegal actions. The spills were detected, mainly, on main and minor ship routes, in the areas of tanker activities, as well as at ports or on moorings (Figs. 1, 3, 4, 5)
Fig. 4. Density map of ship traffic in the Persian Gulf in 2016. © marinetraffic.com
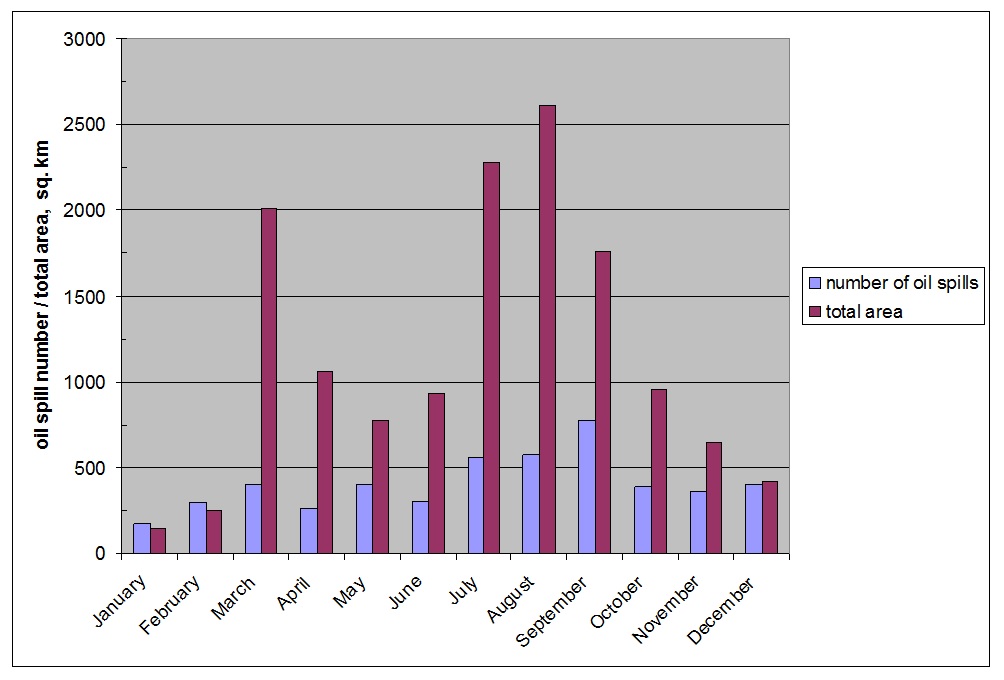
The analysis of the SAR images and the summary map (Fig. 3) allowed not only extraction of qualitative information about the oil pollution in the Persian Gulf, but also quantitative one. The monitoring statistics are presented in Fig. 6 and table; their analysis shows an extremely high pollution of the Gulf in comparison with other areas of the World Ocean where oil production is occurred.
Fig. 5. The position of oil tankers in the Persian Gulf on
Based on the analysis of summary oil spill map (Fig. 3), it is concluded that the Persian Gulf is prone to severe oil pollution, mainly as a result of intensive oil production, oil transportation and active ship navigation. The current situation threatens the Gulf ecology, even with formal observance of the international standards and requirements for environmental protection. Systematic SAR survey of the water areas can help the environmental authorities of the Gulf Countries to monitor the Gulf daily, and can also be used as an evidence base.
Fig. 6. Basic statistics of the monitoring
«At present, satellite monitoring with SAR can be an effective tool for controlling oil pollution in the Persian Gulf waters, since in the frameworks of environmental monitoring satellite observations are not regularly used and analyzed by authorities of the Gulf Countries. The analysis of the SAR data collected during this monitoring made it possible to visually see the extent of oil pollution of one of the most unique basins of the World Ocean and gave new information for understanding the essence of the problem. It is worth hoping that the data and results obtained during this monitoring will contribute to a more reliable protection of the Persian Gulf marine environment from oil pollution, and based on remote sensing, GIS and AIS technologies and geoportal solutions, an effective monitoring system shall finally be created» Andrei Ivanov, leading researcher of Shirshov Institute of Oceanology and Scanex’ expert is commenting.

